
BrianAJackson
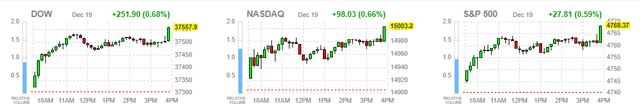
It now looks and feels like there is a panic to buy stocks, as we move closer to a new all-time high for the S&P 500 (SP500). That was a level thought unimaginable by the consensus just two months ago, but it now looks achievable before year-end. The only concern I have, as I’ve reiterated in recent days, is the way we are getting there, which is in a stampede fashion. The moves in the major market indices have been parabolic, which raises concerns for me about stability. If the month of November was about restoring market valuations to levels that fully acknowledge this year’s progress towards a soft landing, then the past couple of weeks look to be discounting good news I hope to see in 2024. That sets high expectations, which makes markets vulnerable to any hiccups along the way. There are always hiccups.
Finviz
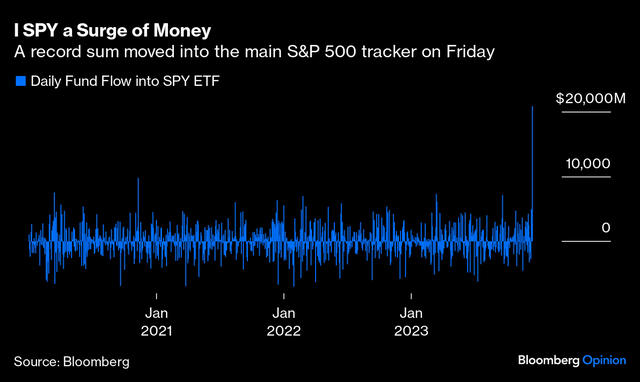
This year-end rally has been a rocket ship, and one can be seen in the chart below, which depicts the amount of money that moves in and out of the SPDR® S&P 500 ETF Trust (SPY) each day. Note the rocket ship on the far right, which depicts the largest one-day inflow into this ETF in history. That occurred on Friday. In addition, net call volume, which measures the bets speculators are placing that stocks will rise rather than fall, is also at the top of its historical range.
Bloomberg
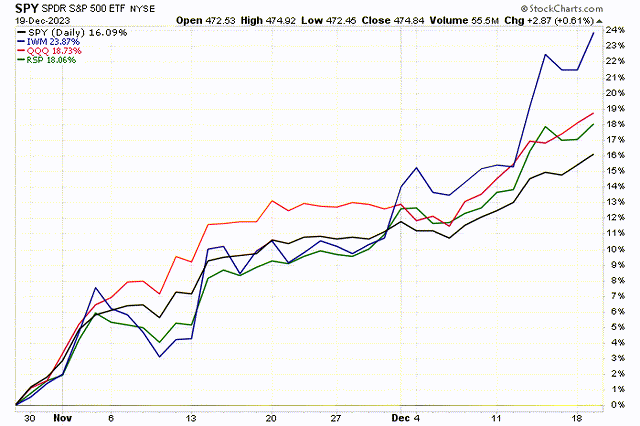
On a positive note, the number one criticism bears had of this bull market through much of this year was its lack of breadth. The past seven weeks have laid that argument to waste, as the Russell 2000 small-cap index (RTY) is leading all major market indexes with a gain of nearly 24% over this period. The equal-weight S&P 500 (RSP) has outperformed its technology heavy market-cap weighted version as well.
Stockcharts
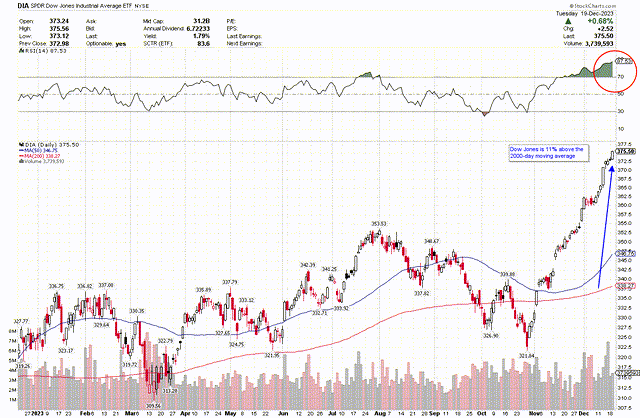
Yet I’m still looking at parabolic moves, like the one in the Dow Jones Industrial Average ETF (DIA) below, which just hit an all-time high and asking myself the question-does this chart look sustainable? The Relative Strength Index is nearly off the chart, while the benchmark is more than 11% above its 200-day moving average. If this were a stock, no matter what its merits, I’d be trimming the position if I had a sizeable gain.
Stockcharts
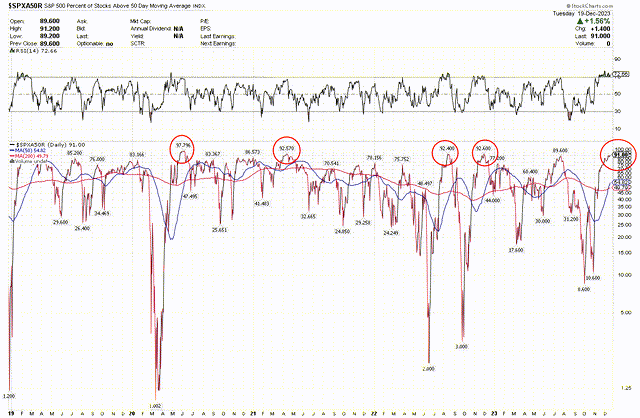
Furthermore, the percentage of stocks in the S&P 500 trading above their 50-day moving average is now at 91%. Over the past five years, we have seen this level on just four occasions. Each was followed by a pullback in the market that resolved the extremely overbought condition.
Stockcharts
Lastly, according to Bank of America’s most recent global fund manager survey, investors are the most optimistic they have been since January 2022. Fund managers have increased their weighting in stocks to levels not seen since the Fed started raising interest rates, and cash weightings have fallen to a two-year low. It is even more extreme when it comes to bonds, where fund managers are overweight to levels not seen in 15 years. Ugh!
That said, don’t misinterpret me calling for an end to the bull market or joining the thinning ranks of bearish prognosticators. I am still the same bull I have been all year long, but I am looking for ways to pull back on risk in the event the hysteria subsides, and prices fall to resolve this overbought condition. Therefore, taking a chip or two off the table seems like a prudent move. When prices do pull back, it should be a buying opportunity, whenever it comes.